











Short answer
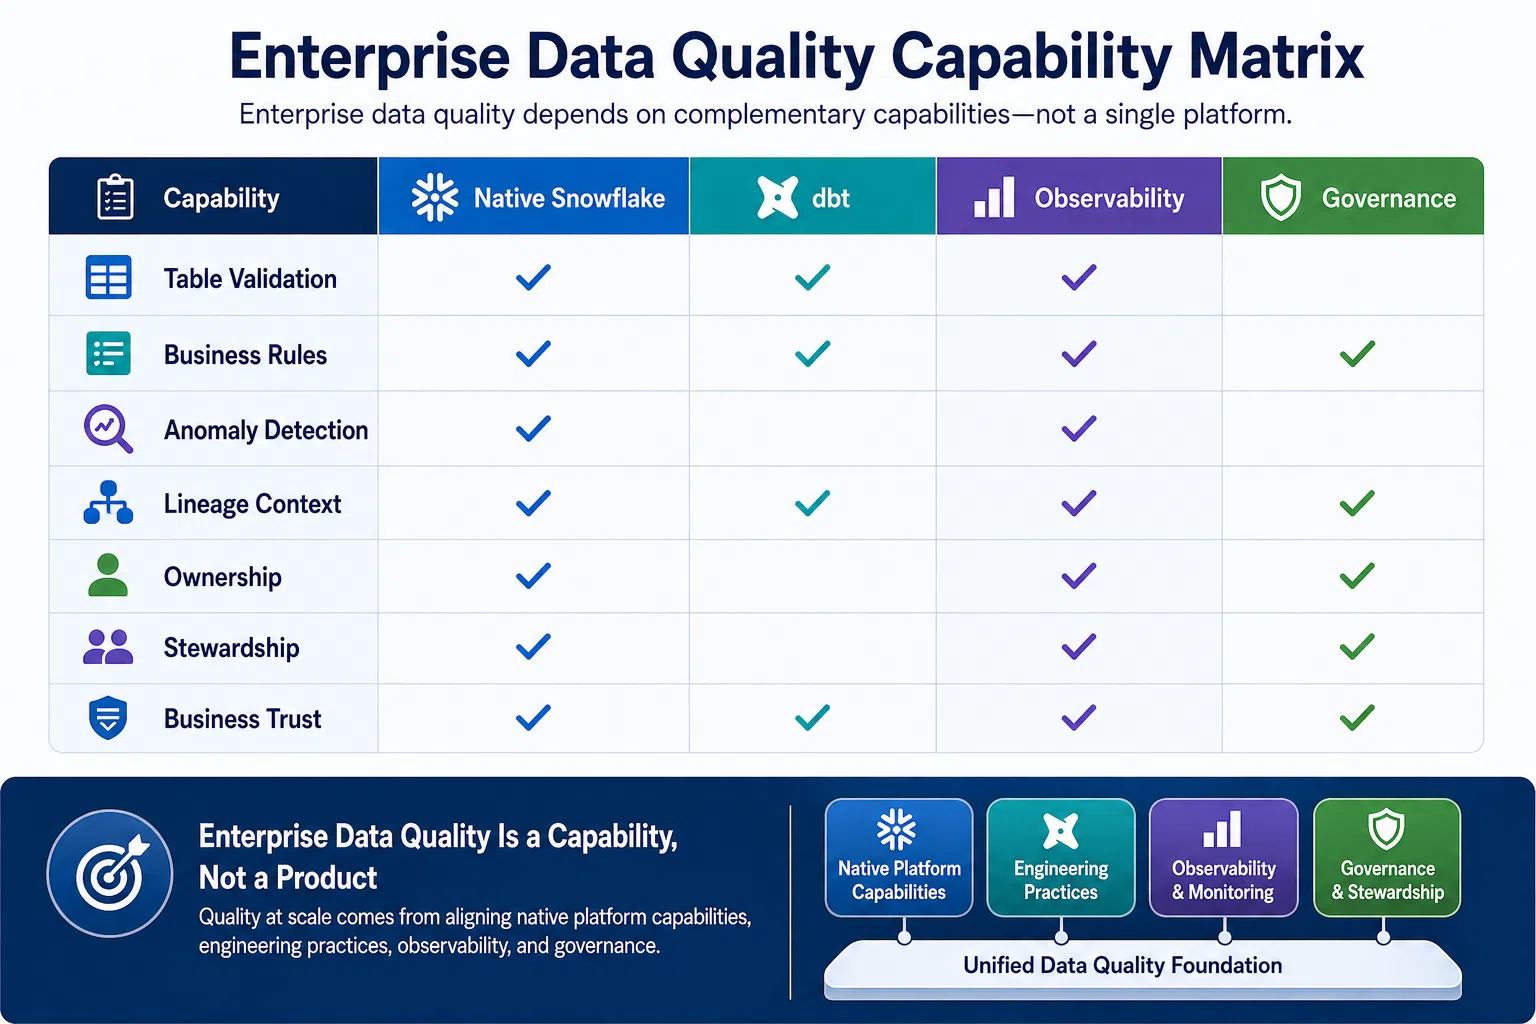
Scaling data quality management in Snowflake requires moving from manual query-based checks to automated, continuous monitoring embedded in your pipelines. Snowflake’s native Data Metric Functions (DMFs) provide a solid foundation for table-level quality checks. For cross-table validation, schema change detection, and anomaly alerting at scale, dbt tests, Streams and Tasks, and data observability tools like Monte Carlo or Great Expectations extend that coverage. The practical framework has three layers: quality at ingestion, quality at transformation, and quality at consumption, each with different tooling and alert thresholds appropriate to the data’s downstream risk.
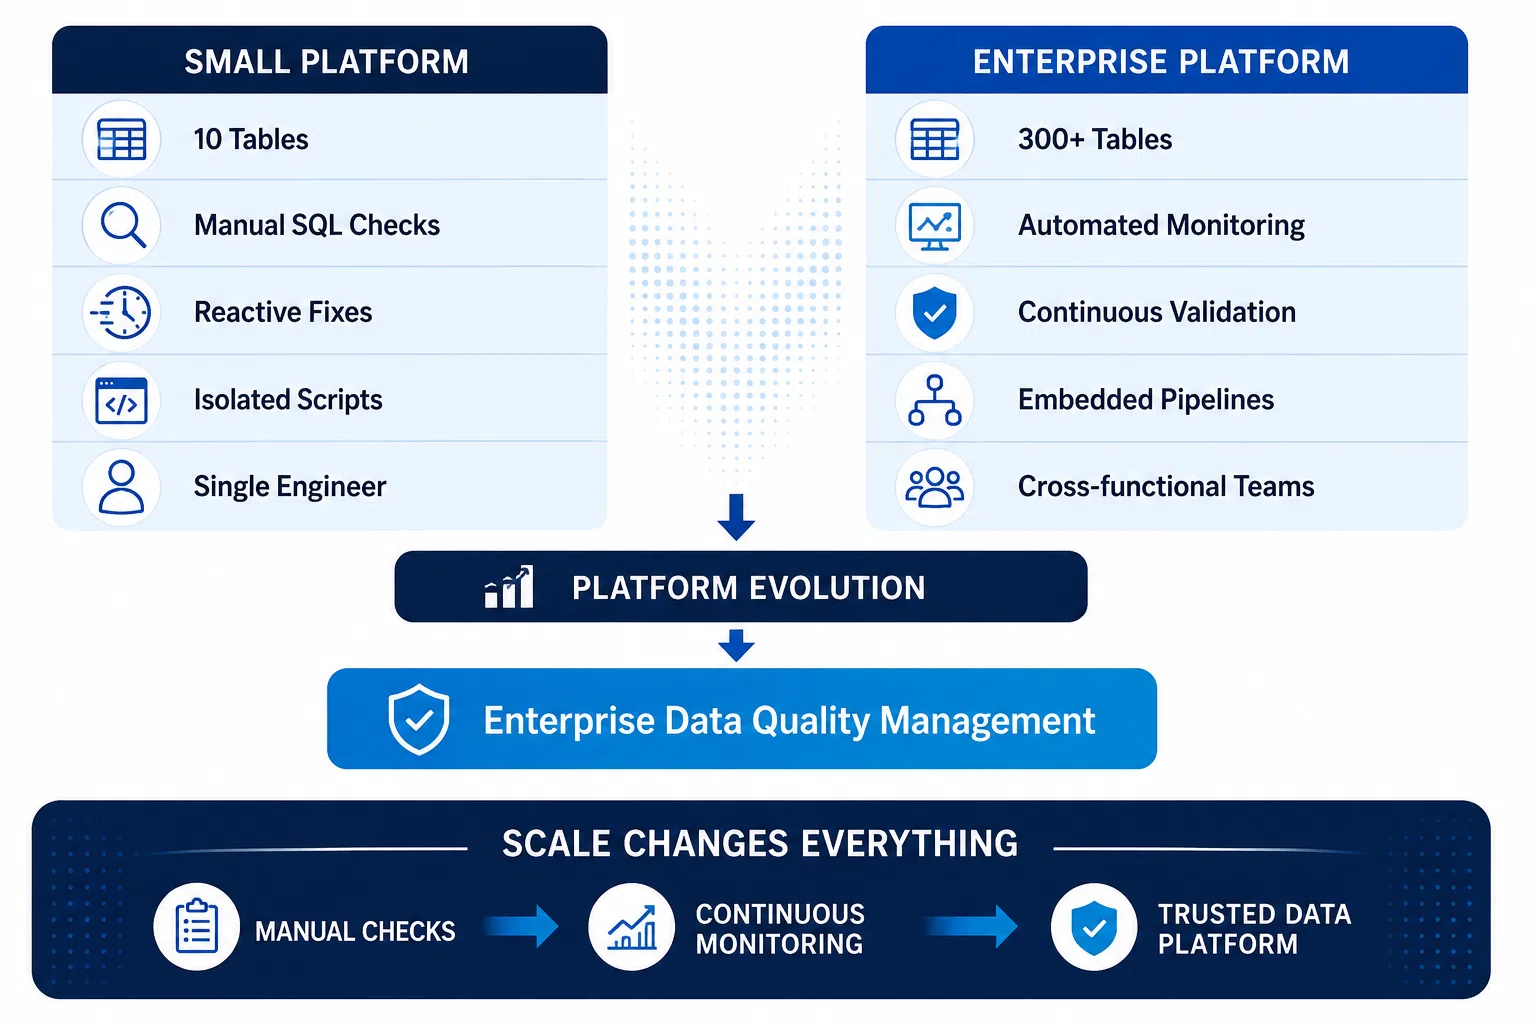
Most Snowflake implementations start with the same quality approach: a handful of SQL queries that run after each major load to check null counts, row counts, and obvious duplicates. This works at 10 tables and 5 sources. It does not work at 300 tables, 40 source systems, and a team shipping pipeline changes every day.
As platforms scale, issues propagate downstream before the morning check script runs. Schema changes in source systems break pipelines silently. Anomaly detection requires comparing against historical distributions a hand-written query cannot efficiently compute. Based on BluEnt’s experience across enterprise Snowflake implementations, most quality incidents originate at the ingestion layer, not in transformations, yet most monitoring is built at the consumption layer where issues are already expensive to fix.
This guide covers how to move from reactive quality management to automated, continuous monitoring across a Snowflake data platform, using native Snowflake features and the right third-party integrations at each layer.
Table of Contents:
Why Data Quality Becomes Harder as Snowflake Scales The specific failure patterns that emerge as data volume, source count, and team size grow
The ingestion boundary problem
Snowflake aggregates data from many source systems: SaaS applications, operational databases, event streams, third-party data providers, and flat file uploads. Each source system can change its schema without notifying the data platform team. A column is renamed. A previously required field starts arriving as null. Data type changes from integer to string. Snowflake’s semi-structured data support (VARIANT columns) masks some of these changes, but downstream transformations that parse those fields break without immediate detection.
Teams that monitor quality only at the transformation or consumption layer discover these ingestion-level issues hours or days after they occur, after they have already propagated through the pipeline. By the time the anomaly surfaces in a dashboard, the fix requires reingesting data from the source and re-running all downstream transformations.
The pipeline proliferation problem
As the data platform grows, the number of pipelines multiplies faster than the team does. In a mature Snowflake environment, a single source table may feed 15 to 30 downstream transformations across different business domains. A quality issue in one upstream table silently contaminates all downstream consumers. Without automated lineage and quality monitoring, the team cannot quickly determine which downstream tables are affected when a quality incident is detected.
The team coordination problem
As the engineering team grows, multiple engineers making concurrent pipeline changes introduce a new quality risk: changes that are individually correct but interact destructively. One engineer update join logic on a dimension table. Another adds a new source to the same fact table in the same deployment window. Neither change breaks in isolation. Together, they produce duplicate rows that no pre-existing quality check was designed to catch.
From the field
The most common Snowflake quality failure pattern we see is not in the production transformation layer. It is at the ingestion boundary. Source systems change schemas without notice; new null patterns appear in upstream extracts, and volumes spike or drop unexpectedly after source-side business process changes. Teams that build quality monitoring at the ingestion layer catch the majority of quality incidents before they reach the transformation layer. Teams that only monitor consumption discover issues after downstream reports have already been distributed.
Is Your Data Governance Ready to Scale with Snowflake?
Assess your organization’s governance maturity to identify gaps in data quality, ownership, metadata, and governance before they impact your Snowflake initiatives.
Data Governance Maturity Assessment
A structured diagnostic for CDOs, CIOs, and Chief Compliance Officers. 18 questions across six governance dimensions. Receive a scored maturity profile and prioritised recommendations.
Your Details
Your Assessment Results
Overall Governance Maturity Level
Receive Your Full Report
A BluEnt governance consultant will prepare a personalised report with specific recommendations for your highest-priority gaps. Book a 60-minute discovery call to discuss your findings.
Snowflake’s Native Data Quality Capabilities in 2026 DMFs, Streams and Tasks, Time Travel, and zero-copy cloning
| Feature | What it does | Scale fit | Best used for |
|---|---|---|---|
| Data Metric Functions (DMFs) | SQL-based quality checks are scheduled on Snowflake tables. System DMFs include NULL_COUNT, DUPLICATE_COUNT, ROW_COUNT, FRESHNESS. | High | Continuous table-level monitoring. Results in SNOWFLAKE.LOCAL.DATA_QUALITY_MONITORING_RESULTS. [Verify table name before publish] |
| Streams + Tasks | Streams detect row-level changes (inserts, updates, deletes). Tasks run SQL on a schedule. Combined: detect volume anomalies and unexpected deletes automatically. | High | Pipeline-level anomaly detection. Catching unexpected row drops or spikes between loads. |
| Time Travel | Query data as it existed at any past point (up to 90 days on Enterprise). Useful for debugging when a quality issue is introduced. | Medium | Root cause analysis and data recovery. Not a monitoring tool, a diagnostic tool. |
| Zero-copy Cloning | Create a full copy of a table or schema instantly, with no additional storage cost until the clone diverges. Use for quality testing without affecting production. | High | Safely testing transformation logic changes against production data volumes. |
| Dynamic Data Masking | Apply masking policies to columns containing PII or sensitive data. Analysts query the masked view; the underlying data remains ungoverned only to privileged roles. | High | Combining data quality access with governance policy enforcement on sensitive columns. |
| Snowpark | Python, Java, or Scala code executing inside Snowflake. Write complex quality logic (ML-based anomaly detection, cross-table referential checks) natively. | High | Quality checks that require logic too complex for SQL alone. |
Data Metric Functions in practice
DMFs are the cornerstone of Snowflake’s native quality tooling. A DMF is a SQL function attached to a table where Snowflake runs on a defined schedule and whose results are written to a system table for monitoring. You can use Snowflake’s system DMFs for common checks or write custom DMFs for business-specific validation logic.
Attaching a system of DMF to a table requires a single ALTER TABLE statement. The example below attaches a null count check and a row count check to the orders table. Verify scheduling syntax against current Snowflake documentation before publishing, as scheduling options are updated periodically:
— Attach system DMFs to a table
— Note: verify scheduling syntax against docs.snowflake.com/DMF before publishing
ALTER TABLE orders
ADD DATA METRIC FUNCTION SNOWFLAKE.CORE.NULL_COUNT
ON (customer_id)
SCHEDULE = ‘TRIGGER_ON_CHANGES’;
ALTER TABLE orders
ADD DATA METRIC FUNCTION SNOWFLAKE.CORE.ROW_COUNT
ON ()
SCHEDULE = ’60 MINUTE’;
DMF results are queryable from SNOWFLAKE.LOCAL.DATA_QUALITY_MONITORING_RESULTS. Teams can build Snowflake dashboards or export results to their alerting system to trigger notifications when quality thresholds are breached.
Custom DMFs extend this to business-specific logic. The example below checks whether order amounts fall within an expected range, a check that no system DMF provides:
— Custom DMF: flag orders outside expected amount range
— Note: verify current custom DMF CREATE syntax at docs.snowflake.com before publishing
CREATE OR REPLACE DATA METRIC FUNCTION orders_amount_range_check()
RETURNS NUMBER
COMMENT = ‘Count of orders with amount outside 0.01 to 1000000 range’
AS
$$
SELECT COUNT(*)
FROM orders
WHERE order_amount < 0.01 OR order_amount > 1000000
$$;
Note: DMFs run inside Snowflake and consume compute credits. For very large tables (100B+ rows), full-scan DMFs on a frequent schedule can add meaningful cost. Apply data sampling in your custom DMFs for large tables or use TRIGGER_ON_CHANGES scheduling to run checks only when data is modified rather than on a fixed interval.
Need Help Improving Data Quality in Snowflake?
Connect with our data governance specialists to design, implement, and optimize scalable data quality frameworks for your Snowflake environment.
A Three-Layer Data Quality Framework for Snowflake Ingestion, transformation, and consumption, each with appropriate tooling and alert thresholds
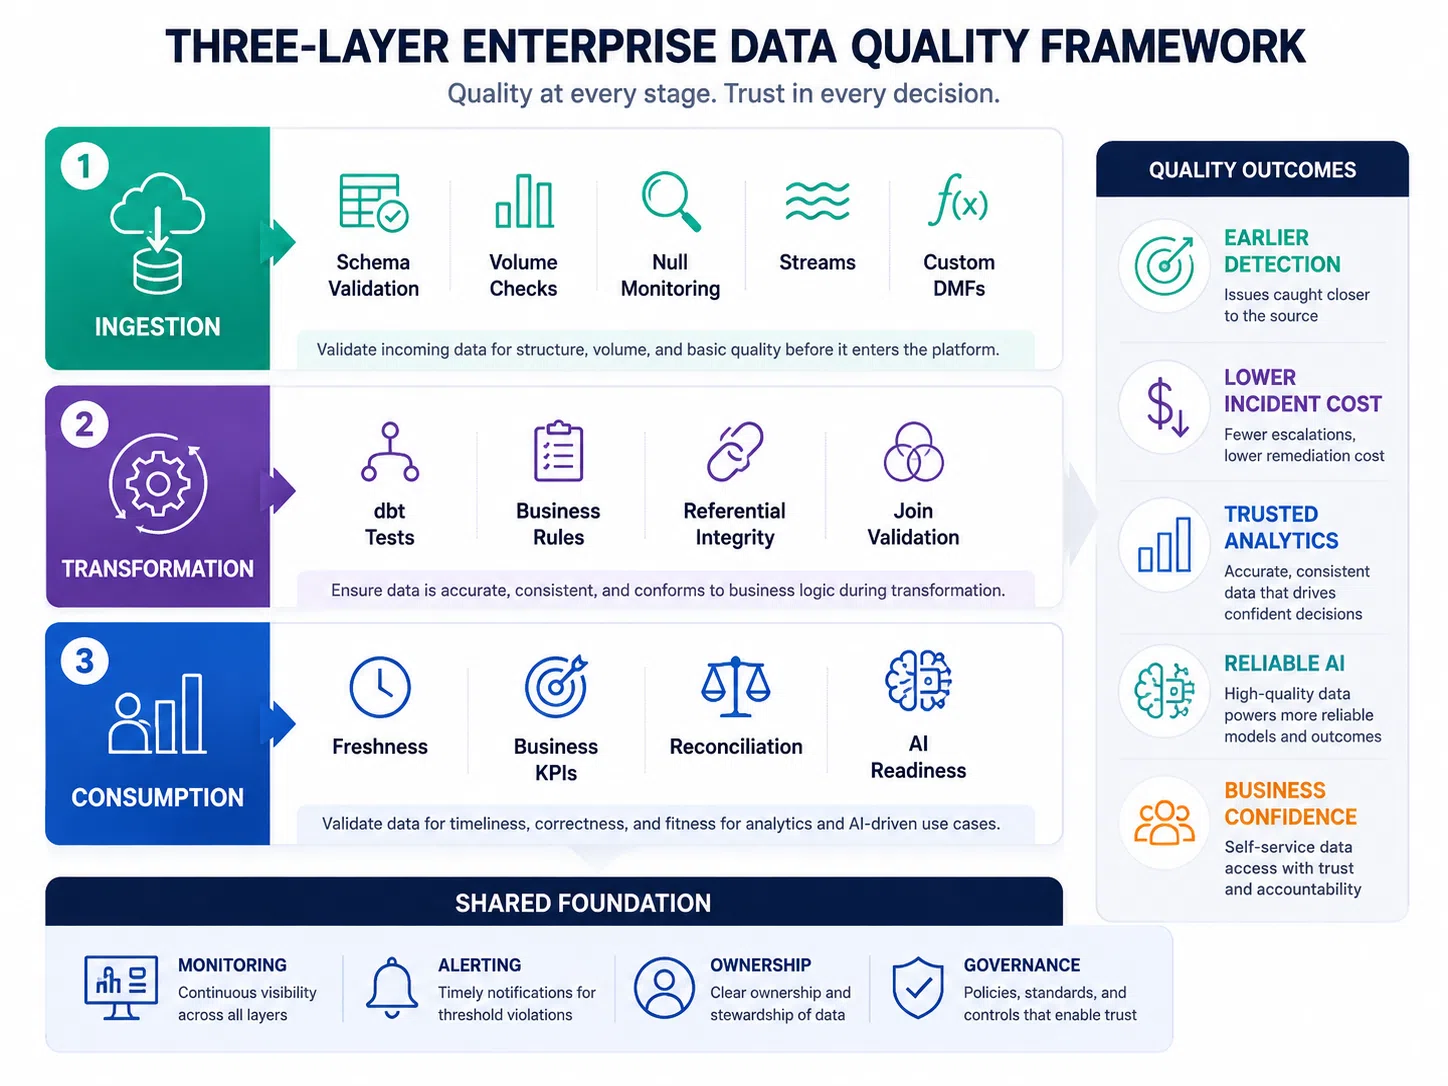
Layer 1: Quality at ingestion
The ingestion layer is where data enters Snowflake from source systems. Quality checks here catch schema changes, unexpected null rates, referential integrity failures, and volume anomalies before bad data enters the transformation pipeline. Issues caught here affect only the staging table, not any downstream consumers.
The right tooling at ingestion is a combination of Streams (to detect row-level changes and volume deltas) and custom DMFs (to check null rates and schema-specific constraints on staging tables). For teams using Fivetran, Airbyte, or other ELT connectors, schema change detection can also be handled at the connector layer before data reaches Snowflake.
-
Volume checks: flag when row count in a load is more than 2 standard deviations from the rolling 30-day average
-
Null rate checks: alert when a previously fully populated column exceeds a defined null threshold
-
Schema validation: detect new columns, dropped columns, or data type changes in source tables
-
Referential integrity: verify that foreign key values in staging tables exist in the relevant dimension tables before loading to the modeled layer
Layer 2: Quality at transformation
The transformation layer is where staging data is modeled into facts, dimensions, and aggregates. Quality checks here validate that transformation logic produces correct outputs: no unintended row multiplication from fanout joins, no dropped rows from overly restrictive filter conditions, correct aggregation logic on financial and operational metrics.
dbt tests are the most widely used tool at this layer for teams using dbt as their transformation framework. dbt’s built-in tests (not_null, unique, accepted_values, relationships) cover the majority of transformation-layer quality requirements. Custom dbt singular tests handle business-specific validation logic. All test results are automatically logged and can be surfaced in dbt Cloud or exported to Snowflake for centralized monitoring.
# dbt schema.yml: standard quality tests on a fact table
models:
– name: fct_orders
columns:
– name: order_id
tests:
– unique
– not_null
– name: customer_id
tests:
– not_null
– relationships:
to: ref(‘dim_customers’)
field: customer_id
– name: order_status
tests:
– accepted_values:
values: [‘pending’, ‘processing’, ‘shipped’, ‘delivered’, ‘cancelled’]
Layer 3: Quality at consumption
The consumption layer is where data is exposed to analysts, BI tools, and AI/ML pipelines. Quality checks here focus on freshness (is the data current enough for the time-sensitive use case?), business rule validation (does this aggregate match the expected range for this reporting period?), and comparison checks (does the Snowflake figure match the source system reconciliation figure?).
Snowflake’s FRESHNESS system DMF and custom row-count delta checks are the primary tools here. For BI-layer quality, data observability tools like Monte Carlo provide automatic freshness alerts and anomaly detection on BI datasets without requiring manual threshold configuration for every table.
Teams that implement quality monitoring at all three layers rather than only at consumption tend to detect incidents earlier in the pipeline, where they are cheaper to fix. A quality failure caught at ingestion requires rerunning one pipeline. The same failure caught after downstream transformations and reports have been distributed requires rerunning every affected transformation and notifying every downstream consumer. The investment in in ingestion-layer monitoring pays back quickly in reduced incident response cost.
Recommended Reading:
Extending Coverage with dbt, Observability Tools, and Governance Integration When native Snowflake quality tooling is sufficient and when third-party tools are the right investment
When native Snowflake DMFs are sufficient
For teams with up to 50 to 100 monitored tables, a straightforward pipeline architecture, and quality requirements focused on null counts, row counts, freshness, and duplicate detection, Snowflake’s native DMFs combined with dbt tests provide sufficient coverage. The native tooling is free beyond computing credit consumption, requires no additional platform licensing, and integrates directly with Snowflake’s alerting and notification system.
Start with native tooling. Add third-party tools only when you encounter specific coverage gaps that native tooling cannot address efficiently.
When data observability tools add significant value
Data observability tools like Monte Carlo, Bigeye, and Acceldata provide value at scale that native DMFs do not cover well: automatic anomaly detection across all tables without requiring manual threshold configuration, cross-table relationship monitoring, machine-learning-based baseline detection that adapts to seasonal patterns, and end-to-end lineage impact analysis when a quality issue is detected.
For environments with 300 or more monitored tables, multiple engineering teams, and business-critical downstream AI or analytics workloads, the time saved on incident detection and root cause analysis typically justifies the observability tool cost within the first quarter of deployment.
Great Expectations for complex validation logic
Great Expectations is an open-source Python framework for defining and running data quality expectations against Snowflake tables. It is the right choice when quality requirements include complex statistical checks, cross-row validations, or business rule logic that is more naturally expressed in Python than in SQL. Great Expectations integrates with Airflow, dbt, and Snowflake Snowpark for pipeline-embedded execution.
Connecting data quality to data governance
Data quality monitoring produces value when its outputs feed the governance program. Quality scores for each governed table should appear in the data catalog alongside ownership, lineage, and business definitions. Analysts evaluating whether a dataset is fit for a use case need to see its quality history, not just its description.
DMF results and dbt test outcomes can be written to Snowflake tables and exposed through your catalog via API integration. This creates a governed data environment where quality is a first-class attribute of every data asset, and where quality degradation triggers a governance workflow, not just an engineering alert.
Note: Data quality monitoring is an engineering capability. Data quality governance is a business capability. Both are required. Quality monitoring without governance produces alerts that engineers respond to without business stakeholders knowing data is unreliable. Quality governance without monitoring produces policies that have no enforcement mechanism. The integration point is the data catalog: quality scores owned by data stewards, displayed alongside business definitions and lineage.
The bottom line
Scaling data quality in Snowflake is an engineering problem with a governance dimension. The engineering part requires automated monitoring at all three pipeline layers, the right mix of native Snowflake tooling and third-party observability tools, and quality checks embedded in pipelines rather than run as manual post-load scripts. The governance part requires connecting quality scores to the data catalog, assigning quality ownership to data stewards, and measuring quality against business SLAs rather than just technical thresholds.
-
Start quality monitoring at the ingestion layer, where the majority of incidents originate in most environments
-
Use Snowflake native DMFs and dbt tests as the foundation, adding observability tools when scale justifies it
-
Zero-copy cloning enables safe quality testing against production data volumes at no storage cost
-
Surface DMF and dbt test results in your data catalog so data consumers can assess quality before use
-
If your team lacks the Snowflake engineering capacity to design and implement this framework, a specialist data quality consulting engagement delivers the architecture and tooling integration faster than building in-house
If your Snowflake environment is growing faster than your quality monitoring coverage, the gap between the two typically becomes visible in an AI project or a reporting incident before the engineering team has time to close it proactively.
Build automated data quality monitoring across your Snowflake platform
BluEnt’s data engineering team designs and implements three-layer data quality frameworks on Snowflake, covering DMF deployment, dbt test architecture, observability tool integration, and catalog connectivity. We work with enterprise Snowflake environments from initial quality framework design through production deployment.
Common Questions What data engineering and platform teams ask about Snowflake data quality at scale
What are Snowflake Data Metric Functions (DMFs) and how do they work?Data Metric Functions are SQL-based quality checks that Snowflake runs on a schedule on your tables and writes results to a system monitoring table. Snowflake provides system DMFs for common checks: NULL_COUNT, DUPLICATE_COUNT, ROW_COUNT, and FRESHNESS. You can also write custom DMFs for business-specific validation logic. You attach DMFs to tables using ALTER TABLE statements, and query results from SNOWFLAKE.LOCAL.DATA_QUALITY_MONITORING_RESULTS. DMFs are available on Snowflake Enterprise tier and above. Source: Snowflake Data Metric Functions documentation, docs.snowflake.com.
Should we use Snowflake native DMFs or a third-party data observability tool?For teams with fewer than 100 monitored tables and standard quality requirements (null checks, row counts, freshness, deduplication), native DMFs combined with dbt tests provide sufficient coverage at lower cost. For larger environments with 300+ tables, multiple engineering teams, and business-critical AI or analytics workloads, data observability tools like Monte Carlo or Bigeye add automatic anomaly detection, machine-learning-based baseline modeling, and cross-table lineage impact analysis that native DMFs do not provide efficiently. Start with native tooling and add observability tools when you encounter specific coverage gaps.
How does dbt integrate with Snowflake for data quality testing?dbt runs data quality tests as part of the transformation pipeline directly against Snowflake tables. Built-in dbt tests cover uniqueness, not-null constraints, accepted values, and referential integrity. Custom singular tests handle business-specific validation logic written in SQL. dbt Cloud logs all test results and can surface failures in the dbt lineage graph, showing which downstream models are affected by a quality failure. Test results can also be written to Snowflake tables for integration with centralized quality monitoring dashboards.
How does Snowflake Time Travel help with data quality management?Snowflake Time Travel allows you to query data as it exists at any past point within the retention window (1 day on Standard tier, up to 90 days on Enterprise). For data quality management, Time Travel is primarily a diagnostic tool: when a quality incident is detected, it allows the team to query historical states of the table to identify when a specific issue was introduced. This narrows the root cause analysis from “something changed at some point” to “this column’s null rate changed between 14:00 and 16:00 on Tuesday, coinciding with this pipeline to run.” Time Travel does not prevent quality issues, but it significantly reduces the time to diagnose and fix them.
What is the cost impact of running DMFs at scale on Snowflake?DMFs run inside Snowflake and consume compute credits from the virtual warehouse assigned to the monitoring schedule. Full-table-scan DMFs on very large tables (100 billion rows or more) on a frequent schedule can add material cost. To manage cost: use TRIGGER_ON_CHANGES scheduling instead of fixed intervals where possible, apply data sampling in custom DMFs for large append-only tables, and size the warehouse assigned to quality monitoring separately from production query workloads. For most enterprise environments, quality monitoring represents a modest share of total Snowflake compute spend, which is typically well within the cost-benefit threshold given the incident reduction it provides.
How do we connect Snowflake data quality monitoring to our data catalog?DMF results and dbt test outcomes are queryable from Snowflake tables, which means they can be surfaced in your data catalog via API integration or direct query. Most enterprise catalogs (Alation, Collibra, Atlan, DataHub) provide Snowflake connectors that can ingest quality scores alongside table metadata. The goal is to surface the quality score, last quality check timestamp, and quality trend for each governed table in the same catalog view that shows business definitions, ownership, and lineage. This gives data consumers the information they need to assess fitness-for-use before querying a dataset.

 Governing AI Tools in AEC: Copilot, Digital Twins, and Generative Design
  Data Governance for AI and Advanced Analytics: Building the Foundation That Works
  Centralized vs. Federated vs. Hybrid Data Governance: Which Model Fits Your Organization
  Data Governance Roles and Responsibilities in AEC Organizations